Analytics
The dashboard summarises how customers use Back in Stock Alerts. Filter the results by date range and storefront channel.
| Metric | What it measures |
|---|---|
| Alert requests | New customer sign-ups received during the selected period. |
| Sent emails | Notification emails sent during the selected period. |
| Emails viewed | Notification emails that customers opened. |
| Emails clicked | Opened emails in which a customer selected a link. |
| Revenue | Revenue from orders placed within two hours after the customer received a notification email. |
| Conversion rate | Percentage of notified customers who placed an order within two hours of receiving the notification. |
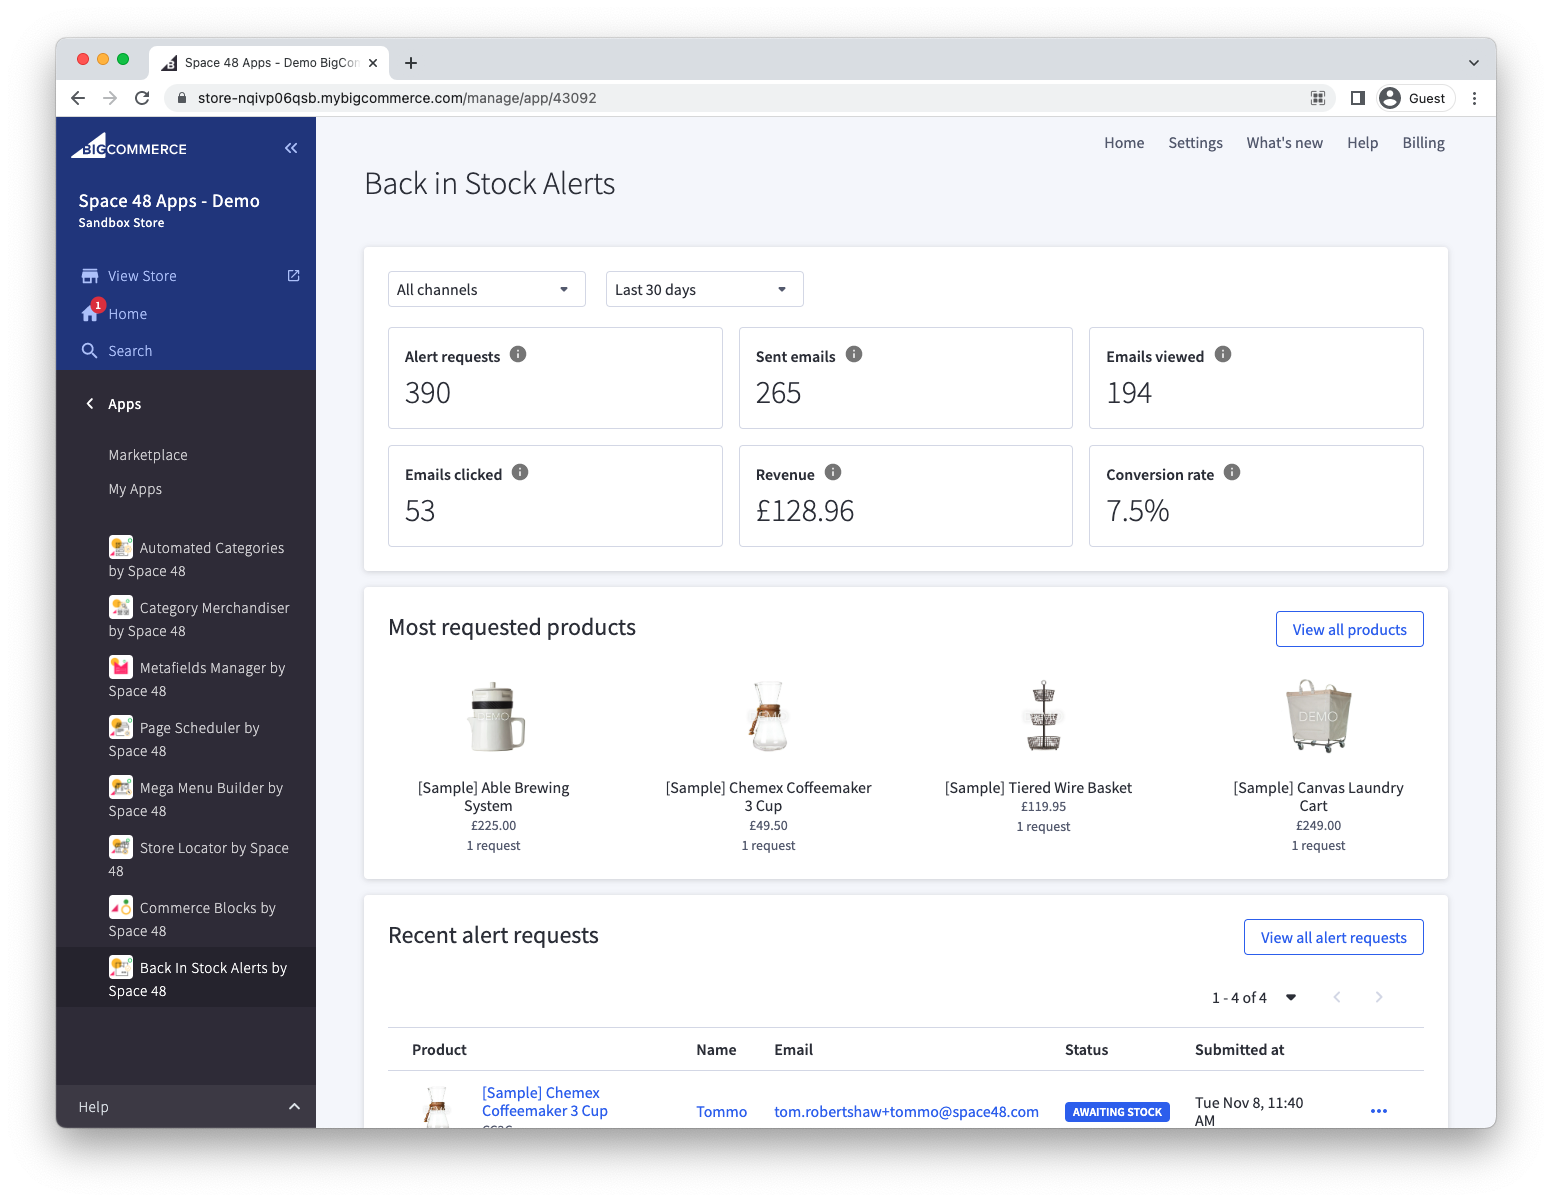
Use these figures to compare demand with the notifications sent and the resulting sales. Attribution is based on the two-hour window described above.